draw.Drawing
Methods
Method Reference: draw.Drawing.plot
draw.Drawing: plot (D)
draw.Drawing: plot (HAX, D)
draw.Drawing: plot (…, Name, Value)
draw.Drawing: H = plot (…)
Draw a draw.Drawing into a figure, to look at it.
draw.Drawing.plot (D) renders the drawing into the current
axes at
equal aspect ratio, honouring each entity’s layer, line type and colour.
draw.Drawing.plot (HAX, D) draws into the axes
HAX instead
of the current ones, as every plotting function in Octave accepts an axes
handle ahead of its data. The 'Axes' pair below does the same
thing
and is equivalent. A figure handle draws into that figure’s current
axes, made if it has none.
H = draw.Drawing.plot (…) returns a column of graphics
handles, one per object created. Every line of one layer, colour, line
style and width is one line object, its pieces split by NaN;
points are markers of one line object per layer and colour; each text
is an object of its own, drawn on top. The 'Tag' of every
object is its layer’s name, so
findobj (HAX, 'Tag', NAME) finds what the layer
NAME drew, to restyle, hide or delete it.
Name/Value pairs
| Name | Default | Meaning |
|---|---|---|
'Axes' | gca | axes to draw into |
'LineWidth' | 0.5 | width in points of every line with no line weight of its own or of its layer, which is drawn at that weight; a weight of 0, DXF’s thinnest line, is drawn 0.13 mm wide, the thinnest pen of ISO 128 |
'FontSize' | 8 | size of text, in points |
'Layers' | all | cell array of layer names to draw |
'Arc' | 64 | segments per full turn when sampling curves |
'Hatch' | 'lines' | 'lines' to fill a
hatch, 'boundary' for its outline alone |
'Linetypes' | 'true' | 'true' to draw
the
real dash patterns, 'approximate' for the figure’s own four
styles |
'LTScale' | 1 | multiplies the dash lengths |
'Margin' | 0.05 | blank space kept between the geometry and the axes, as a fraction of the drawing’s larger side; 0 fits the axes tight to the geometry |
'FontScale' | [] | points per model unit; when
given, each string is sized from its own entity height instead of from
'FontSize' |
'DimScale' | 1 | multiplies the dimension ornament, which is a model dimension: a drawing meant for 1:50 wants 50 here |
Why the axes do not fit tight
Auto-scaled limits stop exactly at the extreme coordinate, so an outline
lying on it is drawn along the frame and reads as part of the axes rather
than as geometry — which is the common case, not a corner one: a plate
is
usually dimensioned from its own edges. Both axes are therefore padded by
the same absolute amount, which keeps the equal aspect ratio the drawing
depends on, and that amount is 'Margin' times the larger of the
two
spans.
What is drawn
Every entity is drawn as the lines, arcs and text it consists of: a
dimension as its extension lines, ticks and label, a spline, path or
region along its curves, a hatch as its loops and its fill lines, clear
of its holes, or as its loops alone with 'Hatch' set to
'boundary'. draw.Drawing.tikz draws the same. Text
is drawn as written, not read as TeX, so braces and underscores stay as
they are.
Line types are drawn properly, not approximated
A figure offers four line styles and this package defines seven line
types,
so setting linestyle would collapse three of them onto their
neighbours — CENTER, DASHDOT and PHANTOM would all come out dash-dot,
and a
phantom line would be indistinguishable from a centre line.
Instead each run of geometry is cut into its dashes and the pieces are
drawn,
so all seven patterns render as themselves. Dash lengths are in the units
of
the drawing, multiplied by 'LTScale', which is the model-space
convention CAD uses. A drawing spanning tens of millimetres therefore
needs
no adjustment; one spanning metres wants an 'LTScale' to match.
The dashes are pieces of their layer’s line object, split by
NaN, so a long dotted line costs points rather than objects.
Set 'Linetypes' to 'approximate' on a large drawing to
draw with the figure’s four styles instead, and leave the lines whole.
Text is not to scale by default. A figure sets font size in points, which does not track the data units the drawing is in, so text cannot both sit at the right size and stay there when the axes are zoomed. It is drawn at a fixed point size, positioned correctly.
That is right for a screen and wrong for a sheet, where a string must
come
out at the height the model gives it. Pass 'FontScale', in points
per model unit, and each string is sized from its own entity height
instead:
at a plot scale of 1:S that factor is 72 / (25.4 *
S),
which is what draw.Drawing.print supplies. For a rendering where
text is to
scale by construction, use draw.Drawing.tikz.
See also: draw.Drawing, draw.Drawing.tikz, draw.Drawing.print, draw.Drawing.write
Source Code: draw.Drawing
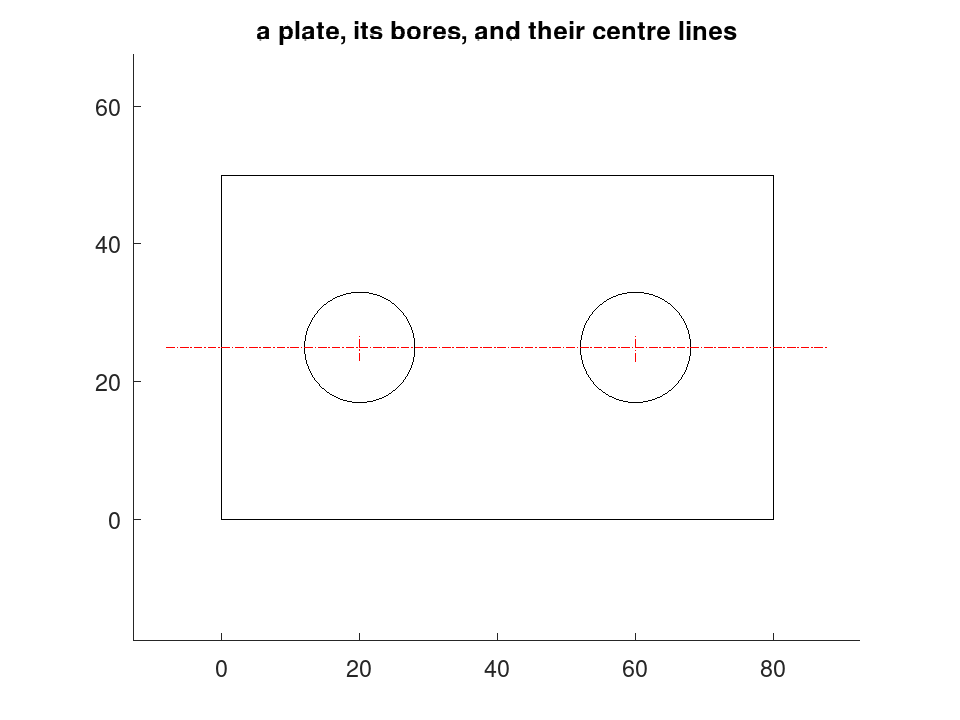
plot renders a drawing at equal aspect, honouring layer, line type and colour. It plots what entities produces, which is what the file backends write, so a figure shows what the recipient will get.
 D = draw.Drawing ('plate');
 D.Layer = 'OUTLINE';
 D = D.polyline (geom.Polyline ([0, 0; 80, 0; 80, 50; 0, 50], ...
                                'Closed', true));
 D = D.circle ([20, 25], 8).circle ([60, 25], 8);
 D.Layer = 'AXES';
 D.Linetype = 'CENTER';
 D.Colour = 'red';
 D = D.centremark ();
 D = D.line ([-8, 25], [88, 25]);
 plot (D);
 title ('a plate, its bores, and their centre lines');
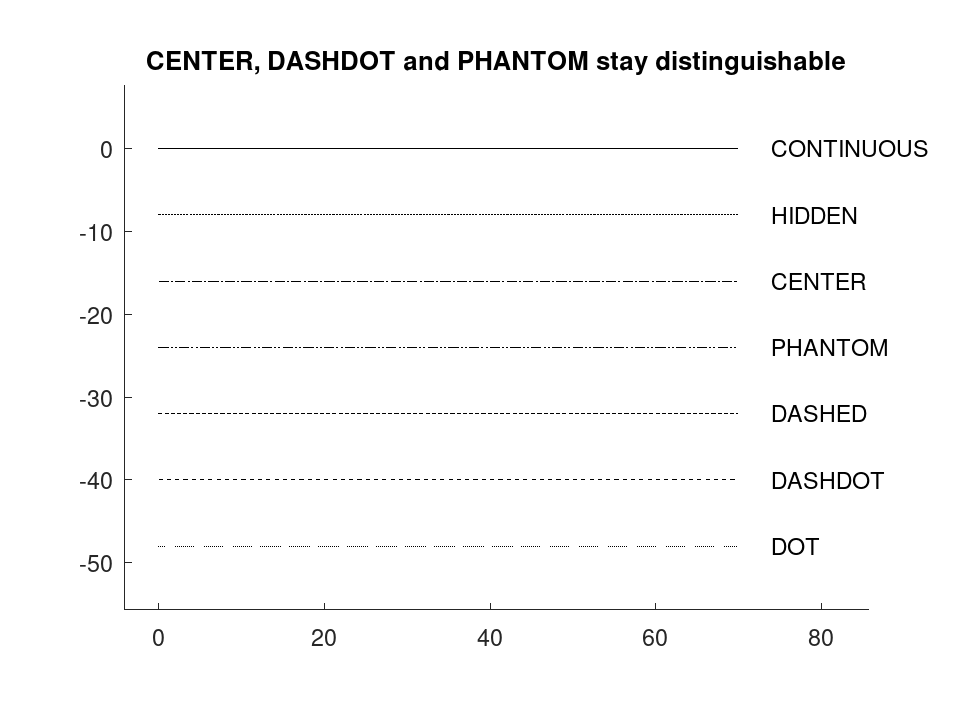
All seven line types render as themselves, because each run is cut into its dashes rather than handed to one of the four styles a figure offers.
 D = draw.Drawing ();
 y = 0;
 for lt = draw.linetype ()
   D.Linetype = lt{1};
   D = D.line ([0, y], [70, y]);
   D.Linetype = 'CONTINUOUS';
   D = D.text ([74, y - 1], lt{1}, 2.5);
   y -= 8;
 endfor
 plot (D);
 title ('CENTER, DASHDOT and PHANTOM stay distinguishable');
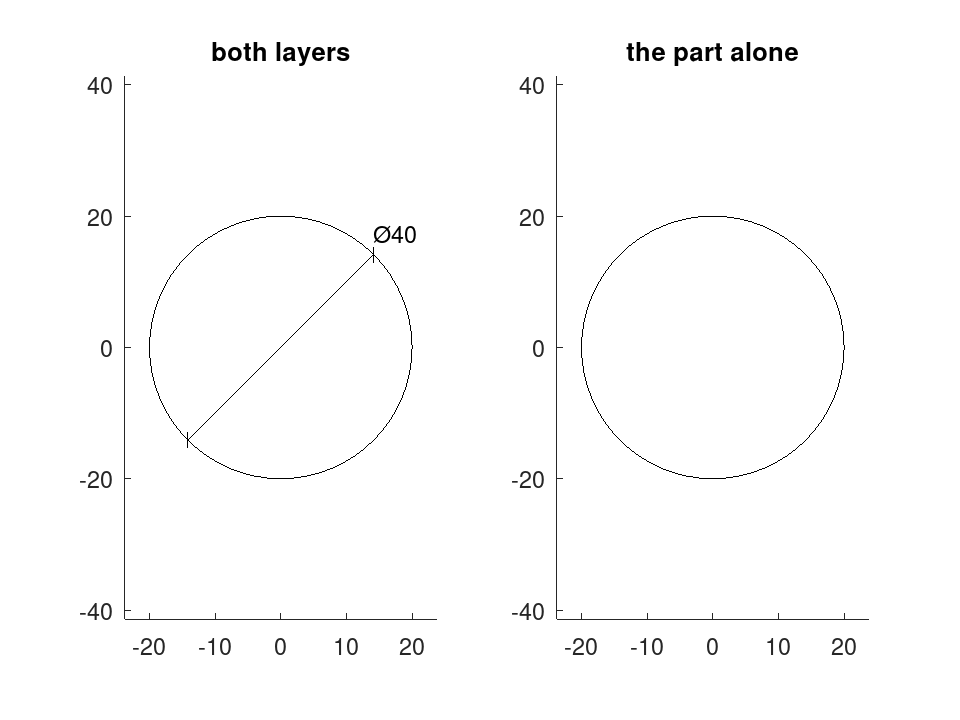
An axes handle may lead, as for any plotting function, and Layers draws only what was asked for --- useful for checking one layer at a time.
 D = draw.Drawing ();
 D.Layer = 'PART';   D = D.circle ([0, 0], 20);
 D.Layer = 'DIMS';   D = D.diam ([0, 0], 20);
 figure ();
 subplot (1, 2, 1);
 plot (gca (), D);
 title ('both layers');
 subplot (1, 2, 2);
 plot (gca (), D, 'Layers', {'PART'});
 title ('the part alone');