Categories &
Functions List
Function Reference: geom.intersectcircle
drafting: P = geom.intersectcircle (L, C, R)
drafting: [P, T] = geom.intersectcircle (…)
Where a line meets a circle.
P = geom.intersectcircle (L, C, R) returns the
points at which the line through L crosses the circle of radius
R centred at C. L is a 2-by-2 matrix of two points on the
line, one per row.
P has two rows where the line cuts the circle, one where it is
tangent, and none where it misses. The rows are ordered along the line, in
the direction from L(1,:) to L(2,:).
[P, T] = geom.intersectcircle (…) also returns where
each crossing falls along the line, as a fraction of the distance from its
first point to its second, so a caller wanting a segment can keep the
rows whose parameter lies between 0 and 1.
The line is infinite, for the reasons given under
geom.intersectlines.
Tangency is decided, not stumbled upon
A line grazing a circle gives a discriminant near zero, and rounding decides whether that reads as two crossings a nanometre apart or as none at all. Both are worse than the truth. The discriminant is compared against a tolerance scaled by the radius, so a line within one part in 10^{12} of tangent returns exactly one point, at the foot of the perpendicular.
See also: geom.intersectlines, geom.intersectcircles, geom.tangentpoints
Source Code: geom.intersectcircle
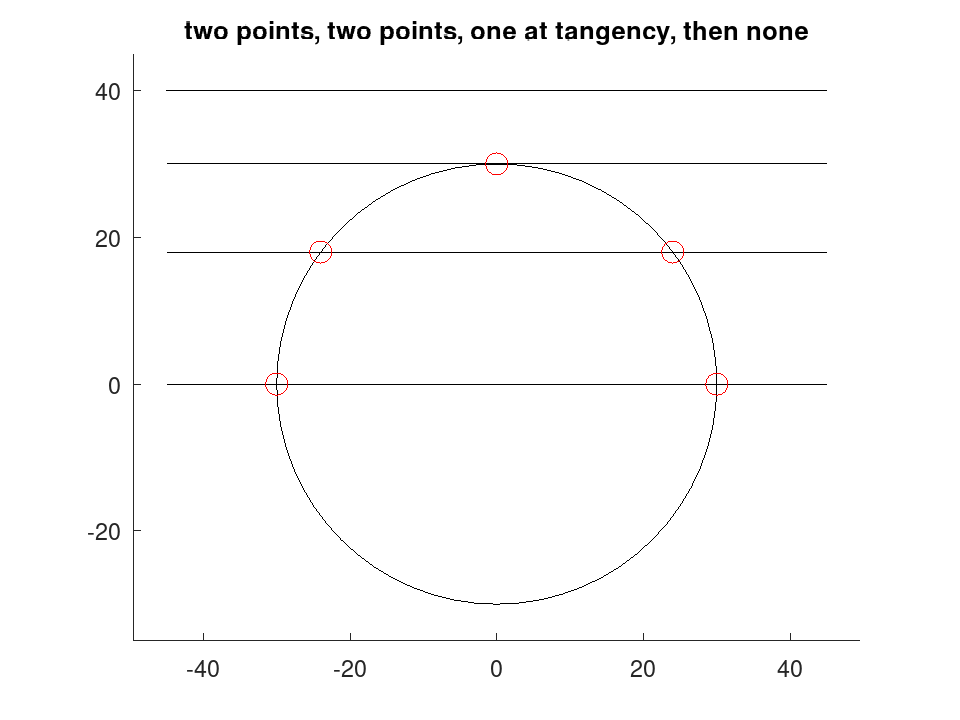
Where a line cuts a circle, in the order it meets them. A tangent gives exactly one point rather than two nearly equal ones.
 C = [0, 0];
 R = 30;
 D = draw.Drawing ().circle (C, R);
 D.Colour = 'red';
 for y = [0, 18, 30, 40]
   L = [-45, y; 45, y];
   P = geom.intersectcircle (L, C, R);
   printf ('y = %2d: %d point(s)\n', y, rows (P));
   D.Colour = 'byLayer';
   D = D.line (L(1,:), L(2,:));
   D.Colour = 'red';
   D = D.circle (P, 1.5);
 endfor
y =  0: 2 point(s)
y = 18: 2 point(s)
y = 30: 1 point(s)
y = 40: 0 point(s)
 plot (D);
 title ('two points, two points, one at tangency, then none');