Categories &
Functions List
Function Reference: draw.coordtable
drafting: D = draw.coordtable (P, ORIGIN)
drafting: D = draw.coordtable (…, Name, Value)
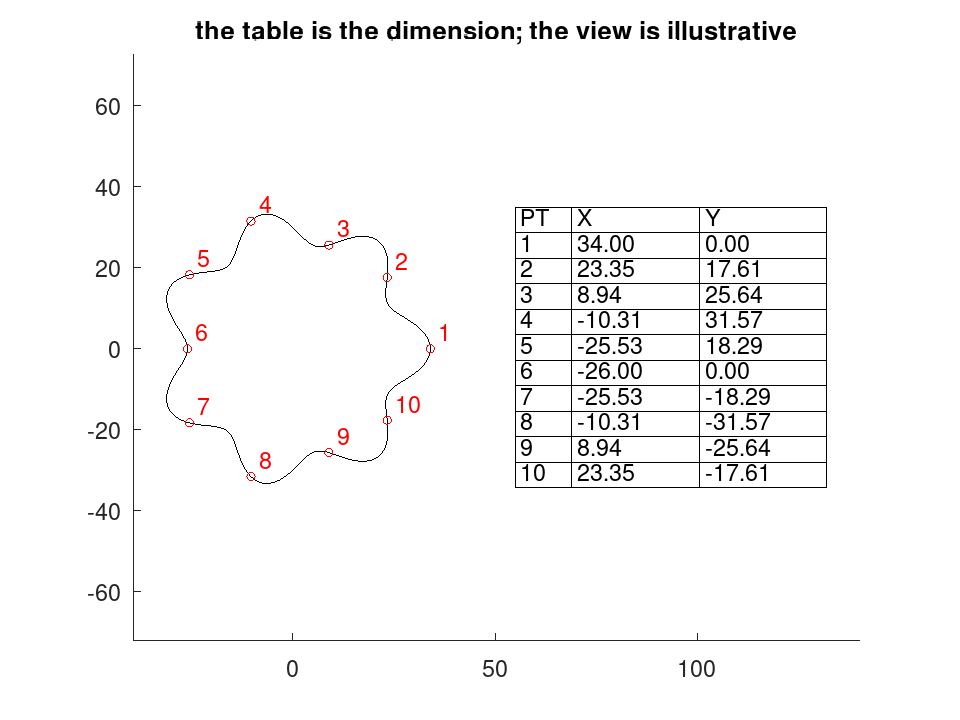
A table of point coordinates, for a shape that cannot be dimensioned.
D = draw.coordtable (P, ORIGIN) returns a drawing
holding a ruled table of the points P, one row each, with its top left
corner at ORIGIN. Merge it onto the sheet beside the view it belongs
to.
Why a table and not dimensions
Some profiles cannot be dimensioned at all. A cycloidal lobe, a cam, an aerofoil and a involute flank have no centres to measure from and no radii that mean anything, so a drawing of one carries a datum, a table of coordinates and the statement that the two together define the part. That is how such a shape is inspected: the machine goes to each coordinate and the measurement is compared against the column.
The table is therefore the dimension, and the profile in the view is illustrative. Which is worth saying on the drawing, because a reader who scales the view instead will be wrong by whatever the plotter did.
Name/Value pairs
| Name | Default | Meaning |
|---|---|---|
'Height' | 3.5 | text height |
'Decimals' | 3 | figures after the point |
'Labels' | numbers | cell array of row labels |
'Heading' | 'PT', 'X', 'Y' | the three column headings |
Points are written to Decimals places whatever their value, so a column reads as a column and a trailing zero is not silently dropped. Three places is a micron in millimetres, which is finer than anything this package’s own output is accurate to and about right for an inspection table.
The table is drawn on a layer of its own, 'TABLE', defined with
the narrow 0.25 mm line of ISO 128, so it can be restyled, moved or
dropped as one.
See also: draw.titleblock, draw.Drawing, geom.resample
Source Code: draw.coordtable
Some profiles cannot be dimensioned: a cam, an aerofoil or a cycloidal lobe has no centres to measure from. Such a drawing carries a datum and a table of coordinates, and the two together define the part.
 t = linspace (0, 2*pi, 361)(1:360)';
 P = (30 + 4 * cos (7 * t)) .* [cos(t), sin(t)];
 pts = geom.resample (P, 10, true);
 D = draw.Drawing ().polyline (geom.Polyline (P, 'Closed', true));
 D.Colour = 'red';
 D = D.circle (pts, 1);
 D = D.text (pts + [2, 2], arrayfun (@num2str, 1:rows (pts), ...
                                     'UniformOutput', false), 2.5);
 D = D.merge (draw.coordtable (pts, [55, 35], 'Decimals', 2));
 plot (D, 'FontSize', 6);
 title ('the table is the dimension; the view is illustrative');